
Grid connection constraints have become central to development decisions and pipeline economics across the UK renewables market. Through our work with developers and grid teams, we have seen how these constraints shape which opportunities are pursued, which are reconsidered, and where development capital is committed.
The challenge is practical: deciding which opportunities are worth pursuing, where the real network constraints sit, and whether an apparently constrained project still has a viable connection route.
Drawing on these insights, we developed Grid Twin, a system that brings together network data, connection queues and grid-team knowledge to support development decisions.
The system reflects recurring operational challenges across renewable development, with applications designed around the decisions grid and development teams need to make.
This paper describes the problem it was built to solve, how the system works in practice, and what we learned along the way.
Grid connection had become a development constraint
The UK renewables market expanded rapidly over the first half of the decade, supported by a policy push to build substantially more clean generation. The connection queue expanded with it: by March 2024, projects seeking connections across the transmission and distribution networks represented more than 700 GW of capacity, several times what the system would ultimately need. The subsequent connections reform and Gate 2 process were designed to bring that queue back towards projects that were both ready and needed.
For a renewable developer, this made grid increasingly central to the economics of building a pipeline. Each opportunity required a view on where it could connect, what capacity was actually available, which upstream assets constrained it, and what other projects were already competing for the same part of the network.
Getting to that answer across Great Britain was difficult. The six DNO groups publish network models, capacity data and connection queues across 14 licence areas, using different structures, identifiers and levels of detail. The electrical path from a proposed connection point back through Primary, BSP and GSP often had to be reconstructed. Queue projects then had to be linked to that physical network, and successive releases compared to understand what had changed.
That work consumed scarce grid-engineering capacity on every opportunity. If done too late, land, engineering and development spend could already be committed to a weak connection case. If done manually across the full pipeline, it limited how many opportunities the team could assess and how quickly it could react as network and queue conditions changed.
Connection applications accelerated sharply
New transmission connection applications, GW
Three recurring decisions shape grid development
In practice, these challenges surface at three points in the development cycle: deciding where to invest further, testing whether a weak connection case could be improved, and understanding what changes in the queue mean beyond a single project.
Which opportunities are worth pursuing?
Before investing further, development teams need to know whether a project has a credible connection case.
That required bringing together several layers of information:
- downloading the latest network, capacity and queue publications from the relevant DNO;
- loading and interpreting CIM equipment models;
- reconciling substations, transformers and circuits across datasets using different names, identifiers and structures;
- reconstructing the electrical path from Primary through BSP and GSP;
- calculating headroom and identifying the asset that was actually constraining the project;
- linking connection-register projects back to the same part of the network.
The result was a much clearer basis for deciding which opportunities justified further land, engineering and development spend.
How can we improve the connection case?
Some projects remained attractive even when the initial connection case looked constrained. The next question was whether another configuration could change the outcome.
The system was designed to help explore:
- alternative connection points or transformers;
- spare assets elsewhere on the network;
- different electrical paths and the constraints along them;
- reinforcement options and which network constraint they would remove.
Because the underlying assets, ratings, flows and constraints are already represented in the model, reinforcement analysis becomes a natural extension: change the network configuration or asset capacity, then recalculate where the constraint moves and how much headroom is created.
What does the queue tell us about the market?
The connection queue also became useful beyond individual project assessment. Comparing successive releases gives a view of how development activity is shifting across the network.
The system can be used to examine:
- which projects are entering, moving or leaving the queue;
- where developers are building clusters of projects;
- how project size and technology mix are changing around a BSP or GSP;
- where capacity may be opening up as projects disappear;
- which projects, portfolios or developers could justify an acquisition or partnership discussion.
Doing this reliably requires preserving the history of each release and resolving project names, customer entities and aliases over time, rather than treating each published spreadsheet as an isolated snapshot.
Together, these questions pointed to the same requirement: one underlying representation of the network and the queue, maintained over time, with different applications built on top of it.
Grid Twin: a system built around decisions
Grid Twin is organised around a simple split. Decisions is the user-facing layer where grid and development teams work with the network. Data maintains the underlying model as operator publications and internal knowledge change.
Decisions
The decision layer brings the network, capacity and queue together in forms that can be used directly by the teams:
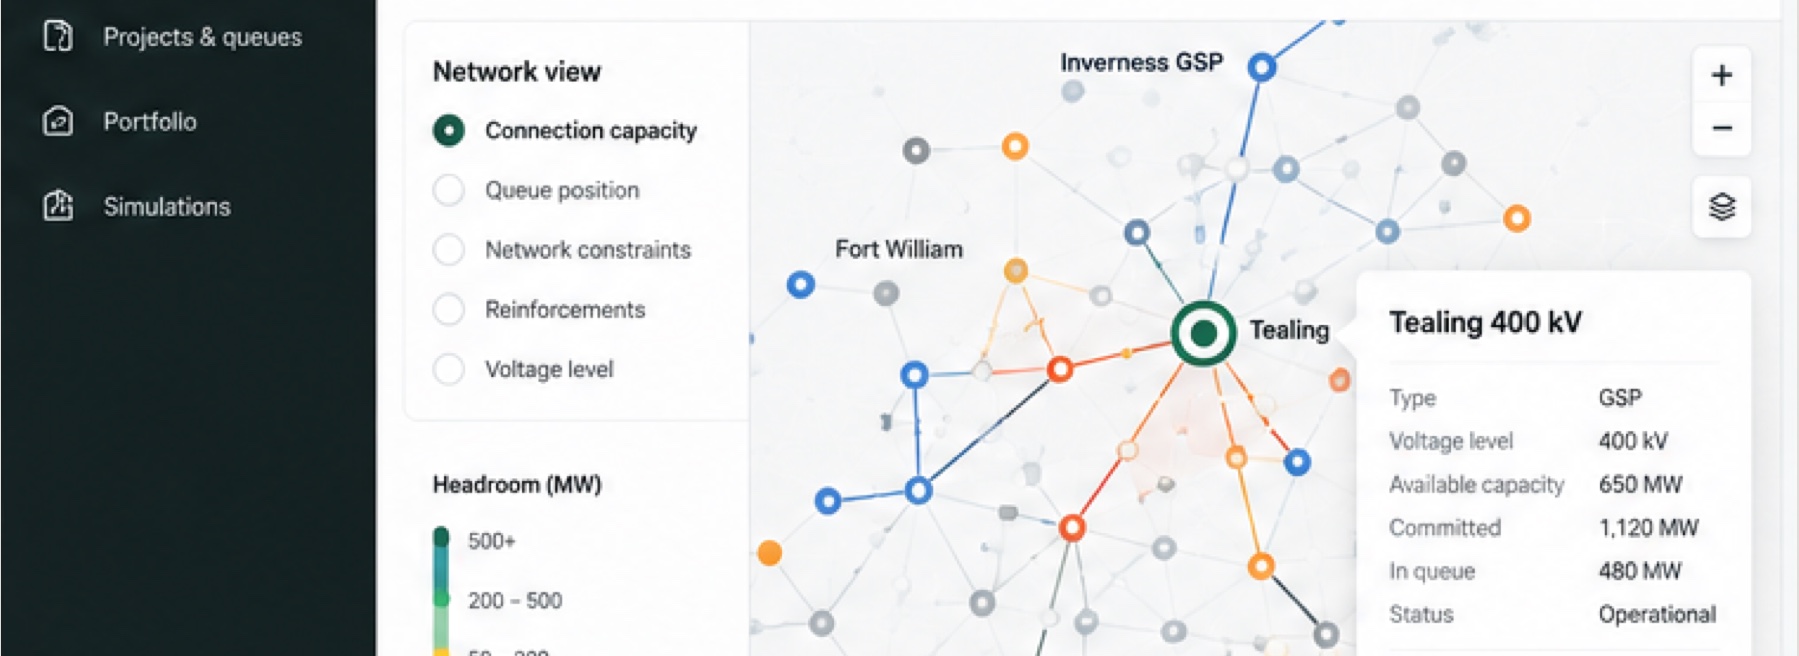
Explorer
Navigate the reconstructed network, trace the electrical path upstream and identify where the binding constraint actually sits, so a project is assessed against the wider network rather than its nearest connection point.
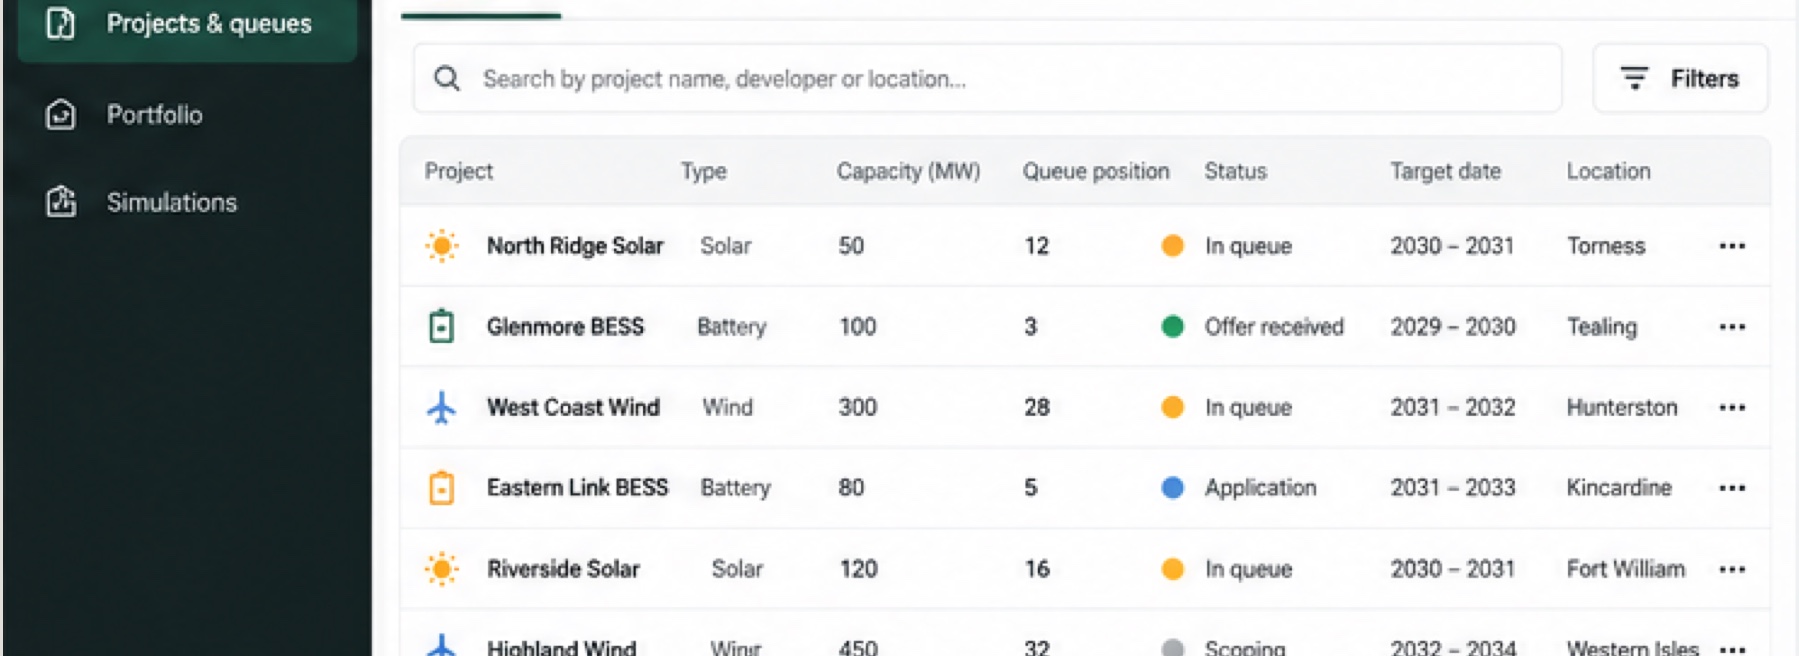
Projects & Queues
Place an opportunity alongside the projects competing for the same capacity and follow how that position changes between ECR releases, including projects entering, dropping out or changing status.
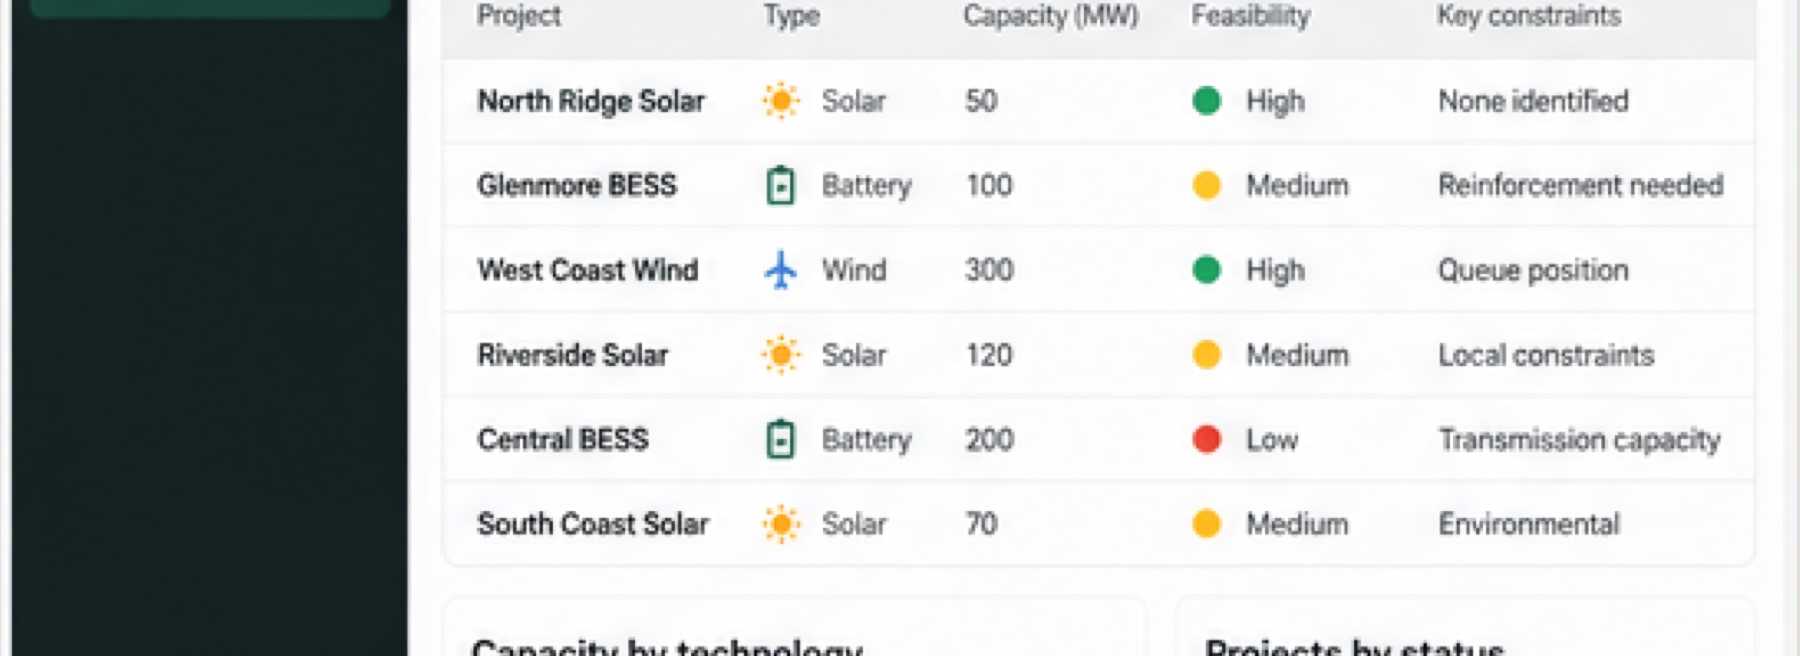
Portfolio & Watchlists
Keep selected projects, substations or network areas under review and revisit them when queue movements or changes in available capacity alter the picture.
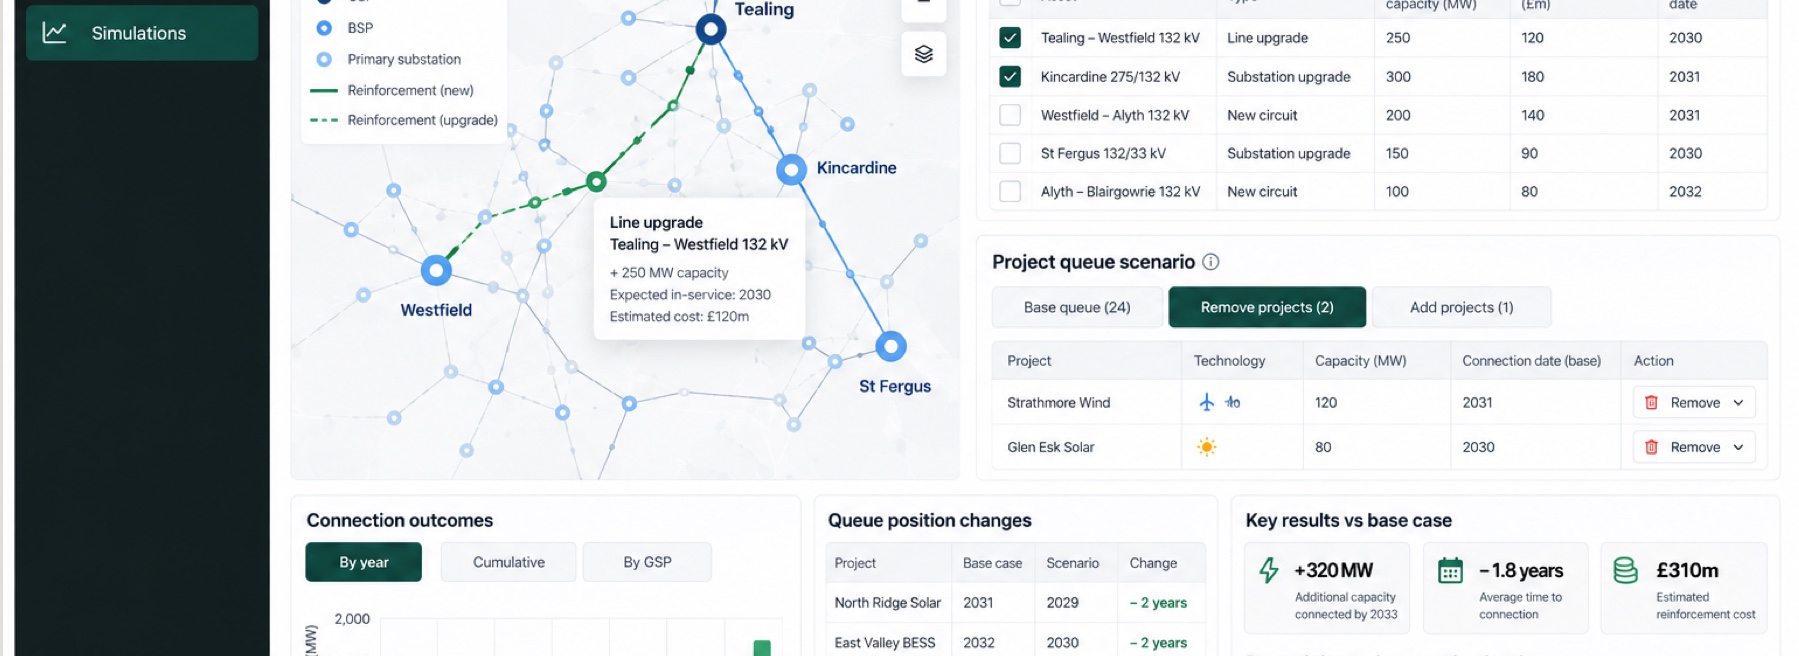
Simulations
Explore alternative connection points, paths and network changes, including potential reinforcements, and recalculate how they affect constraints and available headroom.
These are different views of the same underlying system. An engineer analysing a project, a development team reviewing the pipeline and someone scanning the queue for potential acquisition or partnership opportunities are working from the same representation of the network.
Data
Behind those applications is the less visible part of Grid Twin: maintaining that representation as the source data changes.
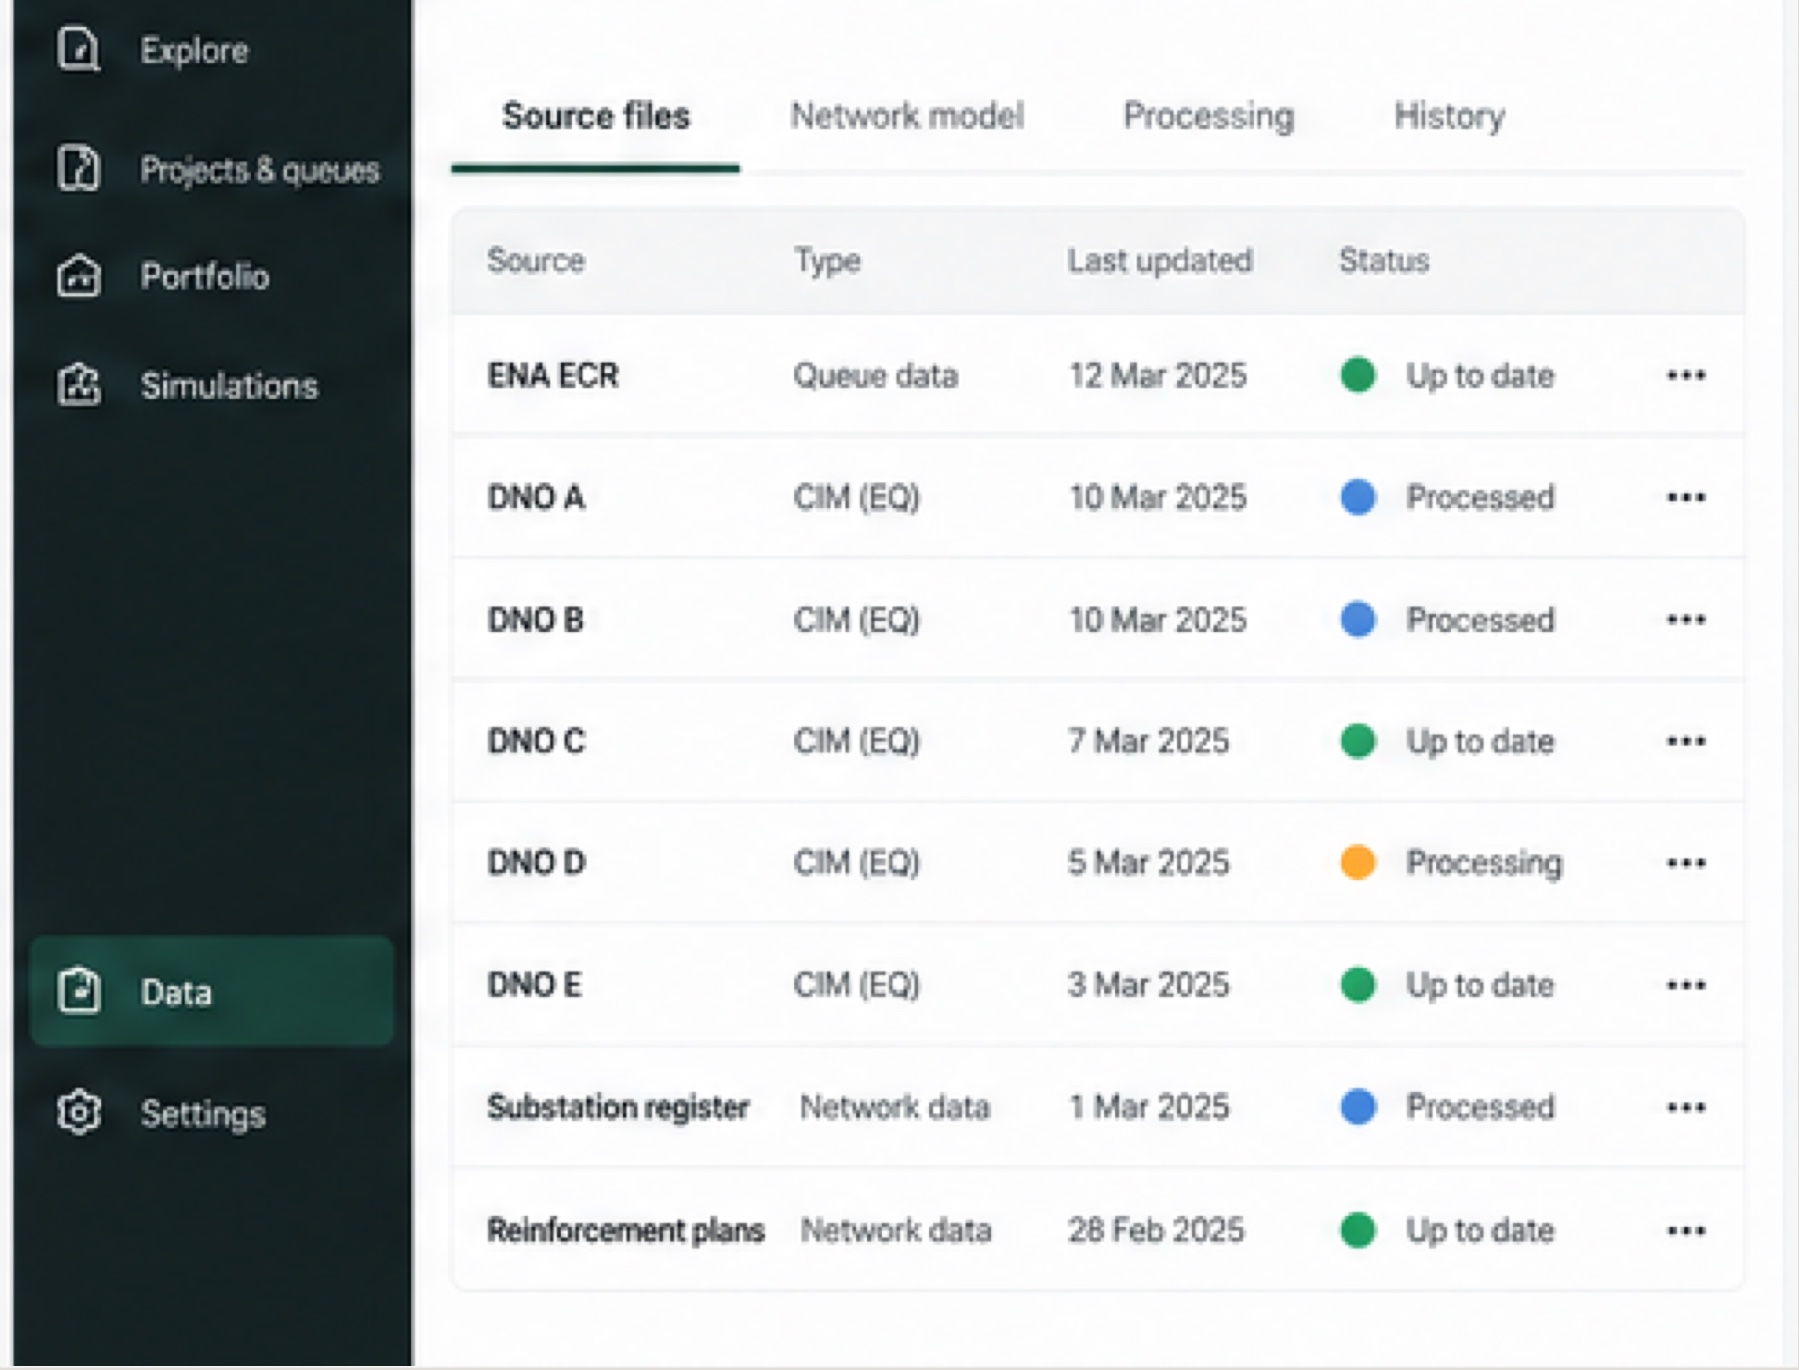
Data from the six DNO groups, including CIM models, capacity publications and connection registers, is ingested and reconciled into a common model. The system resolves differences in identifiers and topology, links queue projects back to network assets and preserves successive releases so changes can be tracked over time.
A dedicated workbench supports the parts that cannot be resolved automatically: matching ambiguous assets and projects, reviewing exceptions and incorporating additional information provided by users or network operators.
The broader pattern
The value of the system shows up in very practical parts of the development model:
Development capital
Weaker connection cases can be identified before more land, planning and engineering spend is committed.
Grid expertise
Specialist time can be focused on the projects and exceptions that require deeper engineering work, rather than rebuilding the same network analysis for every opportunity.
Project optionality
Alternative connection points, network paths and reinforcements can be explored before an otherwise attractive project is dropped.
Origination and M&A
The same underlying data can be used to see where capacity is changing, where developers are building positions and which projects or portfolios may be worth approaching.
More broadly, much of the value-creation opportunity in infrastructure businesses sits in solving concrete operational problems: where to invest, how to remove bottlenecks, how to use scarce resources better, or where new opportunities are emerging.
AI-assisted software engineering is changing the economics of solving those problems. Small teams can now build targeted systems around issues that were previously too specific, too complex or too expensive to justify addressing systematically. A wider class of operational problems is becoming worth solving with software.